Blog
Winning on Value Perception: A Customer Perspective
Whilst Covid undoubtedly created massive retail turmoil, a new trail of economic recession is beginning to grip the global village1. As with earlier recessions, Shoppers will once again focus on value17,11,19. The aim of this discussion is to briefly explain seven of the overlapping determinants of value through price and non-price cues; we have drawn heavily on academic research, shopper data, and our experience.
At the start, it is important to remember that for Shoppers, it’s not about the index…it’s about the total basket cost. And given that Shoppers are visiting less frequently but buying larger baskets (therein spending more per trip), we believe that winning a total-basket value perception on each shopping trip is the most significant challenge that retailers and brands will face from Covid.
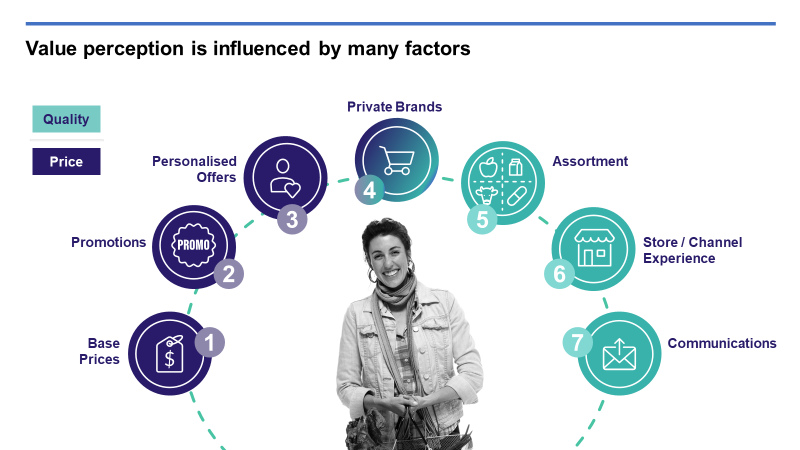
Base Prices
In a recession, price accuracy is likely to increase, which means that Shoppers are more likely to have a sense of the actual price for a product. In a meta-analysis of 297 studies4, it was found that as GDP increases, price knowledge decreases, and conversely. It is not surprising that pre-Covid prosperity reduced the need for Shoppers to pay attention to price. Likewise, this implies price will be of increased importance as finances become more uncertain. And, price accuracy is exacerbated by both national and global economic concern. Given we humans are a social species and are influenced by social norms, simply seeing others focus on value may be an influence even if one is relatively financially secure. Every media, social media, or price comparison website that focuses on economic gloom will only add to this social effect.
Recommendations:
- The Customer First approach to pricing does not change – KVIs, Balance Matrix, how to optimally invest in price, etc – will continue to be the consumer-insight led frameworks for strategic and tactical decisions now, and going forward.
- Example: Getting the base prices right on the items that matter most to Price-Sensitive shoppers is a key first step. The KVI list should be refreshed in light of recent changes in supply and demand.
- Example – The Balance Matrix:
- Ensure that your base prices are logical, coherent, and trustworthy. This is complex because there are hundreds of thousands of products on a typical grocer’s shelves. In terms of the prices charged, the presentation of these products should make sense to a shopper who visits the store regularly.
- For example, the price-per-unit relationship between smaller-sized and larger-sized packages must be logical and consistent. Different flavours of items of the same brand should be priced the same – unless there is a fundamentally different level of quality underlying the flavor difference. Private-label products should show a clear and consistent price advantage over the comparable quality national brands, e.g. always 20% cheaper. When Shoppers are faced with a pricing logic issue, confusion can erode price perception. Coherence builds it.
- Be mindful that Shopper segmentations may change because shopping behaviours have changed. For example, there might now be more Price-Sensitive Customers, which has a knock-on effect to the KVIs, etc.
- Set an internal ‘Basket-Price Index’ to compare your total-basket retail to last year / period to understand if your own basket is becoming more expensive.
A note on… Price Matching
- Price matching has been found to make stores look less expensive14. Furthermore, a price guarantee had a greater effect in the context of a perceived expensive store (e.g. a regional or independent high/low store) compared to a chain store.
- In the context of a recession it is suggested that price matching helps to increase the feeling of price fairness and price transparency16. Fairness is a key concept in behavioural economics13.
- There is a note of caution in a review of service guarantee research15. Customers punish a retailer that offer a price guarantee who are then found to be wanting. It was found to endanger retailer credibility and repurchase intentions.
Certainly, shoppers do not judge value through price alone3. For example, a US survey found Retailer A was perceived to be far more expensive when compared to Retailer B,11. Whilst there was some reality to for this perception – the analysis highlighted that in a basket of 100 items Retailer A was 4% more expensive (index of 104) – Retailer B was more expensive in key categories including coffee, juice and beverages; in other categories they were nearly identical. Somehow, Retailer B enjoyed a price image that punched far above its weight.
Despite the increased focus on price during economic downturn and whilst price deserves full recognition, there are other factors that also influence value.
Promotions
For Shoppers, Price drives trust; Promotions drive excitement. Both levers need to be pulled in concert but at different depths and cadences. With the right Customer Science, retailers can determine which promotions to offer on what products, and with the optimal frequency and generosity for both Customers and margin.
We have already discussed how the industry has been “forced into rehab” to re-examine its practices on promotions. We summarised several suggestions:
- In the short term, we see that some retailers will reflexively execute the remainder of their promotional calendar as originally planned – but this is an opportunity to reset, and certainly, we need different thinking as we strive to match the Covid-related sales spikes
- We have a unique opportunity now to moderate the reliance on promotions to drive L4L sales and to wean off the promotional ‘drug’.
- There is also a unique opportunity to consider other forms of pay for performance in our trade funding conversations, i.e., digital ads and in-store media
- We anticipate implications to cross-promotions in terms of adjacencies, display, and flow as Shoppers seek to maintain social distancing
Recommendations:
- Once again, Customer First principles will continue to apply
- Some decisions, based on a prior reality, might not exist any longer. But the data will lead the way
- Examples: which categories are promoted, which promotional mechanics will be most effective post stock-up, etc
- Focus promotions on the products that your most-strategic Customers buy, e.g. those loyal, most valuable Shoppers, or those most price-sensitive Shoppers. Avoid promotions on items that are more likely to attract shoppers who will visit the store rarely.
- The right promotions can be a great lever to help retain those new Shoppers gained during Covid; look to the data.
Personalised Offers
Targeted coupons, circulars, and digital communications are more effective than mass appeals because they are most relevant to each individual Shopper based on the Customer Science and are optimised to deliver comparably superior sales-to-cost ratios and ROIs. Coupons work in a comparable way to promotions to support the perception of value. Moreover, personalised offers are opaque to the competition who are subsequently blinded to the positive effects of this lever.
Note that ‘personalisation’ is not only about coupons and rewards, but also about helpful content and curation / recommendation. For example, if your weekly flyer contains 200 store promotions, a personalised recommendation via email or app can show each Shopper the 10 that matter to them, amplifying the effectiveness of promotions and aiding in the discovery of value.
And as more Shoppers switch to eCommerce channels, personalisation is a vital driver of a frictionless digital store experience. For examples, delivering a list of a Customer’s regular products for them to choose from, offering personalised substitutes to remove the frustration of out-of-stocks, and suggesting items the Customer may have forgotten based on their own typical online shops all make for a smoother and more valuable digital experience for Shoppers.
A note on… Coupons
Even when times are good, the popularity of small denomination coupons can be difficult to understand. The answer lies in behavioural economics, specifically with the concept of “diminishing sensitivity”13. In short, small denominations are highly prized. There may be joy in winning £100 but doubling your winnings to £200 does not double the joy. Therefore, in relative terms, smaller winnings can provide more joy.
Recommendations:
- Your loyalty programme is a key lever to drive value perception, particularly during this time of greater Shopper needs for savings. Further optimise your investment in personalised coupons by offering more coupons (given bigger baskets and fewer trips; perhaps in smaller denominations as noted above), more frequently (to help with list-building and pre-trip planning) – remembering that ‘behaviour follows rewards’, and always strategically targeted, of course.
- Prepare to redeem more manufacturer coupons (if those are offered in your market).
- Evidence from the US showed coupon usage increased by 27% in 20096 in the grasp of the “great recession”. Furthermore, internet coupon redemption increased drastically by a 263%.
- Given the marked increase in digital shopping during the pandemic, internet coupons are likely to increase in popularity once again. Providing hassle-free acceptance and redemption of online and app coupons is important.
- Particularly for the elderly who may be less technologically inclined but more dependent whilst quarantined with the threat of a second pandemic wave.
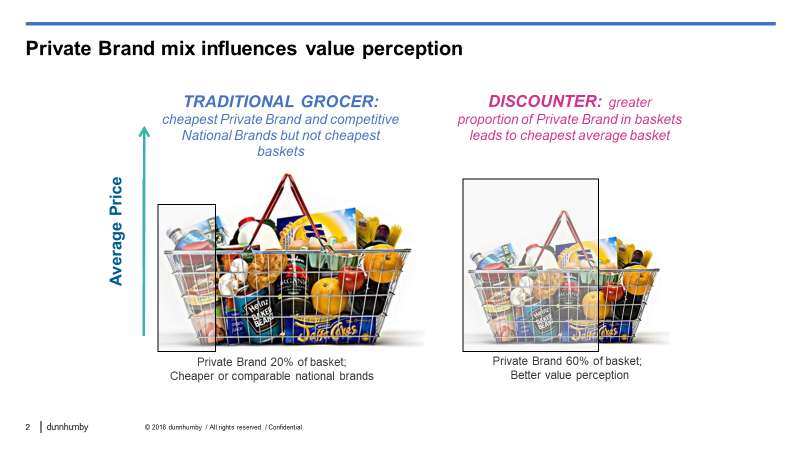
Private Brands
Private Brand products signal to Shoppers that they can get a good value, even if they ultimately choose a national brand. Finding the right mix between Private Brands and national brands is a difficult balancing act for the recession price-sensitive Shopper. Not surprisingly, Private Brand share increases during economic downturns5 and even during times of relative affluence, one-third of Shoppers consciously seek out Private-Brand products to save money, and 70 percent of consumers say store brands are a good option when their preferred brand is not on sale and they don’t have a coupon.
More interestingly, as recession occurs, the switch to Private Brand is faster than switching back to national brands as the economy recovers and some Shoppers stick to Private Brands even when the recession is over. This suggests that retailers would be wise to ensure the breadth and availability of Private Brands during the recession as that can both satisfy Shoppers looking for these and help with overall perceptions of value. The inclusion of Private Brands can also improve the perception of depth, which also influences value perception (as mentioned above).
Recommendations:
- To focus your investments in Private Brand, analyse the Private Brand Lever to understand Shopper expectations for Private Brands by category. This will also give clues as to which PB tiers are most important in each category.
- Similarly, use the same Lever determine which Private Brands to retain, which to promote, which lines would benefit from a Private Brand item and at which quality tier, and which to de-list.
- Give Private Brands the same pricing and promotional attention that you give to national brands. At minimum, consumers expect prices on store brands to be lower — but many retailers don’t consistently enforce pricing rules, leading to issues with logic on the shelf and a confusing message around value perception overall.
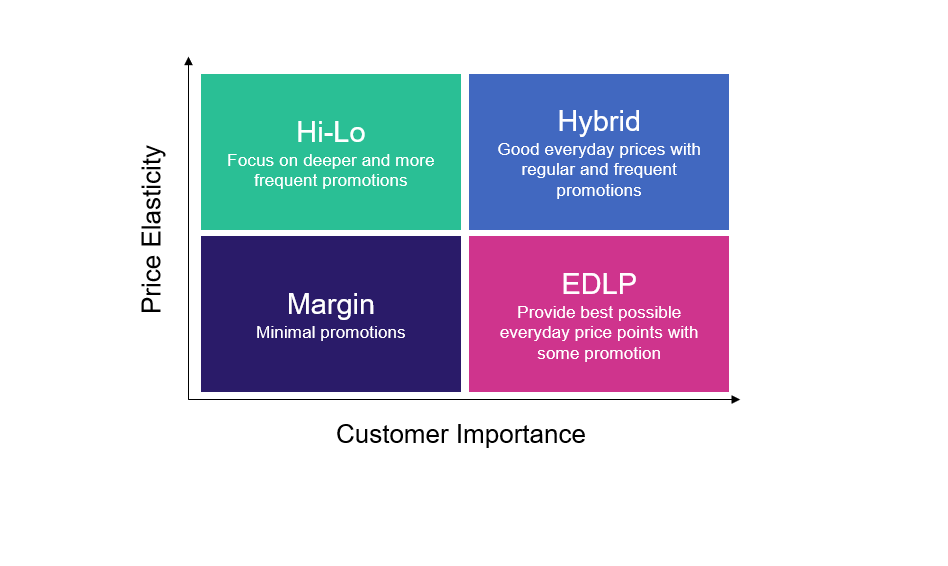
- Shielding Private Brands – deciding whether or not to shield PB when promoting national brands depends on how the PB is positioned (e.g., within a High-Low v. EDLP category per the Balance Matrix above), and also on the tier of PB (e.g., never shield the premium PB line). In principle, we recommend shielding for the value and middle tiers of PB, with a watch out on PB margin where it is less than the comparative national brand
- Execute clear Private Brand display principles, e.g. always position to the left of the comparable national brand. We do not recommend brand blocking for PB lines, but let Customer needs as defined by the Customer Decision Tree be the guide.
Read more on dunnhumby’s perspective on Private Brands here.
Assortment
Beyond Price and Promotion, the depth (i.e. variety within a category) and breadth (i.e. variety across categories) of an assortment can influence perceived value11. Shoppers assume a deep assortment (e.g. big box retailer) has a lower price compared to a shallow assortment (e.g. convenience store). Also, the way an assortment is organised can influence value. A spatially spread assortment may provide the perception of variety, when compared to the same assortment that is organized more efficiently.
The assortment of products and their presentation in-store or online influences price perception. The more entry-level price point and private-label product lines available, research shows the better the overall price perception, because Shoppers perceive that the retailer offers a value option. A strong assortment gives the Shopper multiple choices, at different price points, to make a purchase.
Many times, we see that results vary by store location depending on the affluence of the Customer demographic area. Retailers can then revise their offerings based on this type of data analysis.
- For example, by varying the assortment of BWS products in different locations — including separate displays of beer cans and bottles and offering cider selections according to different flavours — the retailer saw an 11.2 percent sales increase in this product category. The changes in product assortment also correlated to a 5.6 increase in foot traffic through the stores.
The same principal applies when selecting which products to shelve and which to discontinue in our experience. If loyal Customers regularly buy products that you would otherwise de-list, consider keeping it to retain them.
Assortment is a complex affair particularly in the context of economic downturn10. Within a recession (and as the current data hypothesizes that 20% of the restaurant / QSR spend may never return to restaurants / QSR) consumers dine out less, which suggests an opportunity to increase lines relating to take-home meals and cook-at-home kits.
Relating to assortment, Customers bought less fair-trade products in the great recession12; however, this decrease was smaller than expected. Whilst occasional buyers halted purchases, loyal buyers held onto their values and continued to purchase. One reason occasional buyers stopped their purchase was because they avoided Retailer A in favour of another retailer who did not sell fair-trade. Therefore, there may be an opportunity for grocers to provide products that may be restricted to “specialist” stores with a higher price perception.
Recommendations:
- Good-Better-Best: having a clear offer at each level ensures that you have products for all Customer types and for all purchase occasions
- Each category is different – Category Levers help define what the relative ratio / balance of Good-Better-Best should be
- Each store segment is different – flex the ratio by store segment. For example, in price-sensitive stores, set the range at 50% value lines, 35% mid-tier, and 15% upmarket products; flip this ratio for Upmarket stores (directional example only).
- Put breadth before depth, e.g. more variety v. more brands within the same variety
- Ensure that planograms are driven by Customer needs as shown in the Customer Decision Tree (CDT) v. brand blocked or by margin
- Establish consistent and logical product flows and adjacencies to make finding the value lines easier for Shoppers in every section
- FRESH categories’ assortments are very important to value perception – don’t forget FRESH
Store and Channel Experience
Shoppers’ value perceptions are also influenced by ‘body language’ cues throughout the store, seen or felt in physical aspects of the store presentation, and through store policies and behaviours.
Regarding the physical store presentation, for example, there is evidence to suggest that stores with fashionable exteriors and pleasant music have a higher price perception compared to those that may look shabby or untidy7,8. Furthermore, larger stores, (those with large car parks and stores in large shopping centres) are often interpreted as cues for lower prices9. Supporting this view, a US-based expenditure survey found Hypermarkets (e.g. Walmart), Warehouse stores (including Warehouse Club Stores like Costco) and Limited assortment stores (e.g. Aldi) are more popular during a recession6.
Restrictive store policies and behaviours can undermine value perception, e.g. refunds or replacements that require receipts within 30 days of purchase, grudgingly given only by store management after queuing at a “service desk” may unconsciously communicate to Customers that the retailer is not fully committed to offering value for money.
Recommendations:
- Don’t underestimate how store policies can affect value perception, particularly how your Customers experience returns and refunds
- Clutter interferes with shopping ease in normal times, and with the needs for social distancing / limiting exposure risk during current times, and so undermines ‘value of time and effort’
- Make the online shopping experience easier and faster – using lists of personal Shopper preferences like ‘My Usuals’ and recommenders like ‘Cheaper Alternatives’ or ‘Healthier Alternatives’ drives larger online baskets and shorter online shopping times.
- Logical shelf flow helps Shoppers find their value / quality comfort zone, e.g. a ‘good-better-best’ flow that is consistently executed in every section increases the likelihood of incremental units in the basket because the right quality tier is easier to locate.
- How you merchandise reduced-to-clear / markdown areas and sell-by-dates give direct clues to your commitment to value as well
Communications
Most retailers understand the role that marketing plays in setting value perception; the trouble is that if only a few of the other six levers have been activated, then the marketing messages via shelf tags, weekly flyers and other forms of above-the-line advertising feel hollow to Shoppers. Retailers who have successfully and sustainably improved value perception have pulled on all the seven levers.
Recommendations:
- Activate each of the 7 levers of value perception, each pulled to the degree indicated in the insights and in the priority order as defined by Customers
- Total the total-basket savings as a line item on the receipt and call attention
- Clear directional and aisle signing helps Shoppers find products, reducing dwell time (and exposure anxiety) and making the trip easier.
Best Practices in applying the 7 levers of Value Perception
| Base Price | · Price Curve v. Price Index. A Price Curve uses data to recognise the items that are most important in defining value perception and lowers prices on those to be competitive whilst potentially raising prices on non-price-sensitive items. A flat ‘price index’ treats all items the same, which leads to price overinvestment on items that don’t matter |
| Promotions | · 30+% fewer promotions that work harder for the Customers, suppliers, and grocer cutting the long tail based on the data. · Simpler promo types, e.g. one retailer executes only 4 promotion mechanics: money-off (xx-off or ‘round pound (£)’), multi-buys (BOGOF, 3 for 2), bonus pack (500ml for the price of 400ml), and multi-save ($ off entire basket) · ‘Own’ the market with a singular promo mechanic, executed in a regular cadence that Customers can rely on, e.g. 10 for $10 on every feature in the weekly flyer during the 3rd week of each month when Customers are struggling most to stretch their remaining food dollars |
| Personalised Offers | · “My Promotions” curates 3000-4000 TPR offers in the store each week to list the 10 most-important to each Customer, via the digital app or personalised landing page online · 70% of Customers redeem a personalised digital offer via the app, with an uplift per offer and SCR that is greater than that of direct-mailed paper coupons · 60% of Customers exposed to a personalised ‘Have You Forgotten’ recommendation on the eCommerce site add one or more additional items to their basket |
| Private Brands | · Quality guarantee – “Try It and Like It or Get the National Brand Free” · Private Brand always 20%-30% cheaper (comparable quality) |
| Assortment | · Arranging quality tiers from Good at the bottom, to Better in the middle, and Best at the top helps Shoppers more easily find and choose what’s most suitable to their needs. · In FRESH, the data guides on whether to integrate or separate Organic fruit & veg to help set quality or choice tiers in the most meaningful ways for Shoppers |
| Store / Channel Experience | · No-questions-asked returns and refund policies, wherein cashiers are empowered to resolve without management approval · Scan-price guarantee, e.g., item will scan at the shelf price or Customer gets item free · Online substitution policy – never pay more for the substitute than the originally-ordered price even if higher quality |
| Communications | · KVI shelf tags easily assist Customers in finding great value everyday · Promotional shelf tags show only items featured at a savings of 10% or greater – (indeed, never promoting if the savings is not at least 10%) · Weekly flyer is reduced to 8 pages per week (from 16) to save significantly on ATL advertising costs, and each feature in the flyer performs better for the Customer and the business v. those in the 16-page edition |
Final thoughts: tracking Value Perception
We suggest tracking both behavioural and perceptual changes; we call these two dimensions “leading indicators” and “lagging indicators”
- Leading Indicators (behaviour) – Price Index (on different points of the Price Curve), internal Basket-Price Index, total basket spends (over time) amongst Loyal and Price-Sensitive Customers and opportunity shopper segments
- Lagging Indicators (perception) – Customer Satisfaction surveys, Customer Tracker (Customer Promises measures), other bespoke qualitative research
Footnote
The data continues to indicate a trend toward large baskets, and our hypothesis is that this behaviour will endure relative to social distancing habits. There is evidence (US) that large basket Shoppers prefer EDLP stores and small basket Shopper prefer Hi-Lo promotions1. A small basket shopper may be more focused on promotions and may simply defer a purchase if one is not available. The large basket shopper is more focused on expected basket price and is shopping across more categories. Furthermore, other US data indicates that the largest 20% of shopping baskets generate 40% of revenue2. It is important to understand trip missions and how each store segment is meeting Shopper needs within each mission.
1 Bell, D. and Lattin, J.M. (1998). Shopping Behavior and Consumer Response to Retail Price Format: Why Large Basket Shoppers Prefer EDLP. Marketing Science 17(1): 66-88.
2 Martin, J., Nenycz-Thiel, M., Dawes, J. et al (2020). Fundamental basket size patterns and their relation to retailer performance. Journal of Retailing and Consumer Services 54 102032.
References
1 IMF (2020). World Economic Outlook, April 2020: The Great Lockdown. April 2020. https://www.imf.org/en/Publications/WEO/Issues/2020/04/14/weo-april-2020
2 Anderson, R. (2011). Resolved: Whole Foods Isn’t As Expensive as People Think It Is.” The Boston Globe (14 Feb).
3 Dickson, P.R. and Sawyer, A.G (1990). The Price Knowledge and Search of Supermarket Shoppers. Journal of Marketing 54 (3): 42-53.
4 Estelami, H., Lehmann, D. R., and Holden, A. C. (2001). Macro-economic determinants of consumer price knowledge: A meta-analysis of four decades of research. International Journal of Research in Marketing 18 (4): 341–355
5 Lamey, L., Deleersnyder, B., Steenkamp, J. B. E., and Dekimpe, M. G. (2012). The effect of business-cycle fluctuations on private-label share: what has marketing conduct got to do with it?. Journal of Marketing 76 (1): 1-19.
6 Beatty TKM, Senauer B (2013). The new normal? US food expenditure patterns and the changing structure of food retailing. American Journal of Agricultural Economics 95 (2): 318-324.
7 Baker, J., Grewal, D. and Parasuraman A. (1994). The Influence of Store Environment on Quality Inferences and Store Image. Journal of the Academy of Marketing Science 22 (4): 328–39.
8 Brown, F.E. (1969). Price Image Versus Price Reality. Journal of Marketing Research 6: 185–91.
9 Brown, F.E. and Oxenfeldt, A.R. (1972). Misperceptions of Economic Phenomena. Journal of Marketing Research 8: 110–13.
10 Dekimpe, M.G., Gielens, Hall, K.R., et al (2011). Strategic Assortment Decisions in Information-Intensive and Turbulent Environments. Journal of Retailing 87S: S17-S
11 Hamilton, R. & Chernev, A. (2013). Low prices are just the beginning: Price image in retail management. Journal of Marketing 77 (6): 1-20.
12 Bondy T. and Talwar V. (2011). Through thick and thin: How fair trade consumers have reacted to the global recession. Journal of Business Ethics 3: 1–19.
13 Kahnamen, D. (2011). Thinking Fast and Slow. Penguin.
14 Lurie, N.H. and Srivastava, J. (2005). Price-Matching Guarantees and Consumer Evaluations of Price Information. Journal of Consumer Psychology 15 (2): 149-58.
15 Hogreve, J. and Gremler, D.D. (2009). Twenty Years of Service Guarantee Research: A Synthesis. Journal of Service Research 11: 322-343.
16 Ferguson, J.L. (2014). Implementing price increases in turbulent economies: Pricing approaches for reducing perceptions of price unfairness. Journal of Business Research 67: 2732–2737.
17 dunnhumby (2020). Customer First retailer responses to Coronavirus. Eight trends for the future. Shifting Formats & Channels. 20 May
18 Chernev, A., & Hamilton, R. (2018). Price image in retail management. In Handbook of Research on Retailing. Cheltenham, UK: Edward Elgar Publishing.
19 Grewal, Dhruv, Anne L. Roggeveen, Larry D. Compeau, & Michael Levy (2012). Retail value–based pricing strategies: new times, new technologies, new consumers. Journal of Retailing 88 (1): 1-6.
RELATED PRODUCTS
Insights
The latest insights from our experts around the world