Blog
Four steps to optimising online grocery taxonomy and a seamless shopping experience
In previous blog posts, we discussed how online grocery shopping has now become a habit for many people, making it crucial for retailers to optimise this channel and ensure a seamless customer experience through the digital shelf, while avoiding some common pitfalls.
In this blog, we take a deep dive into the importance of optimising the site navigation, focusing on the category hierarchy (also called ‘taxonomy’) and the steps a retailer should take to ensure the best possible product discoverability and a smooth online journey for customers. To bring this to life, we will look at an example of a grocery retailer in Europe who benefited from improving its online presence.
Step 1: Know how customers engage with your site, to assess what needs to be fixed first
Knowing how customers currently browse your website and how the back-end algorithm works in detail is crucial to understand what to fix first, and where to invest your resources to have the quickest and most significant impact on customer experience.
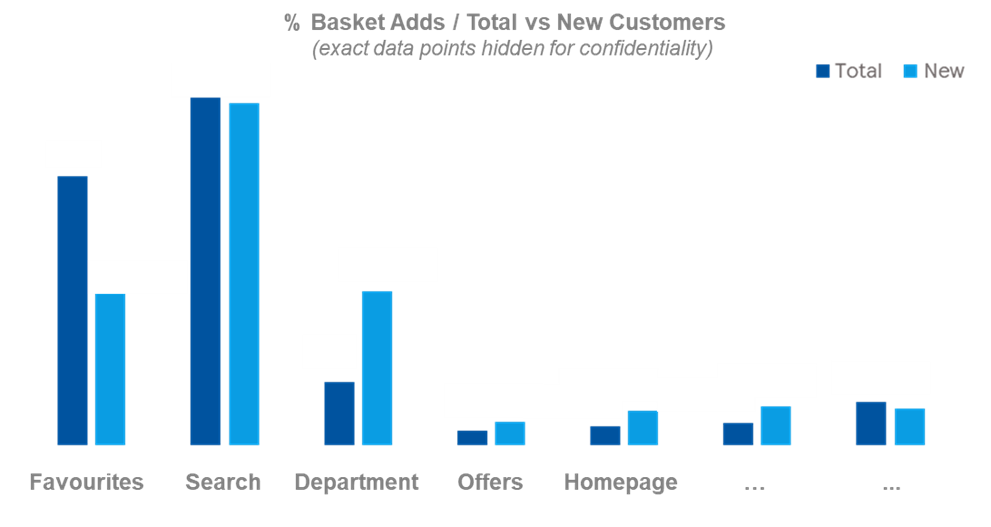
Clickstream data can (and should) be used to explore how your customers (both existing and new) navigate your site and their browsing behaviours, for example the sections they spend more time on or where they add products to their basket from (e.g., from the ‘Favourites’ section? From ‘Offers’? How much do they use the search function to find specific products?).
This data helps understand what should be prioritised, which areas are underperforming, and ultimately how to create the optimal online strategy based on traffic, conversion, and basket removal rates. It’s the equivalent of tracking how shoppers move around in a physical store to find the products they want to buy. This step can be enhanced further with research using techniques such as ‘accompanied surfs’ or targeted surveys that build on knowledge of customer engagement with your website.
We recently helped a specific grocery retailer optimise their online taxonomy (i.e. how the products are classified and grouped); in this case, clickstream data was analysed to find that ‘Search’ (i.e. the search bar at the top of their website) accounts for almost half of all basket adds, while almost 10% (up to 20% for new shoppers) go through the taxonomy (i.e. the digital departments / aisles / shelves) and only 2-3% through other website sections like the homepage.
Examining the algorithm behind the retailer’s website showed that search results are influenced by product titles first, then taxonomy and finally the product description.
What did all of this tell us? That in this case optimising ‘Search’ was the priority to ensure the best customer experience and the highest rate of basket adds, and that we had to improve the product titles and the taxonomy to do so, which would also allow us to convert new customers (as we found that they use the taxonomy more than existing customers).
Step 2: Determine the optimal customer-led taxonomy structure
To create the optimal taxonomy structure, we started by identifying online-specific customer need states, which refers to where customers expect products to sit and how these should be grouped based on how they shop (which is equally important in-store). We did this by using product substitutability data from online transactions via our dunnhumby Assortment ranging tool; this analysis allows us to create a taxonomy structure that reflects customers’ behaviours, making it easier for them to browse a certain category and find the products they want.
Substitutes are discovered by tracking shoppers over time. When we find that shoppers do not put some products of the same area in their basket on a specific trip, we conclude that they are likely substitutes for each other. We then create 'decision trees' where products are grouped based on how substitutable or different they are, which helps identify customers' need states.
This process also highlights potential dual placement opportunities for those items that customers would expect to find under more than one shelf/aisle (which is typically more difficult to do in-store due to physical limitations) and encourages you to reflect on emerging need states or category trends that you might want to dedicate a section of your site to (for example ‘organic’ or ‘eco-friendly’), to anticipate customers’ needs and future-proof the category.
For this specific retailer, this analysis has led to the creation of a number of new aisles and shelves. Taking the Beer, Wine and Spirits (BWS) category as an example, we created two new aisles there, one for gifting and one for on-the-go cans, with the aim of supporting specific customer missions/trends that we identified as important.
Step 3: Assign customer-friendly naming to the taxonomy
Once the new hierarchy structure is defined, it is time to choose the appropriate names for each section (e.g. department, aisle, shelf, filters etc.), to ensure it resonates with customers and is aligned with their language. To do this, each need state identified in the previous step is linked to clickstream data to discover the key search terms used by shoppers. An example of this in BWS could be replacing the word ‘RTD’ (an acronym known to people working in the industry) with ‘Ready to Drink’ or ‘Canned Drinks’, which is easier to understand and more straightforward for most. It might not seem a big difference but putting yourself in customers’ shoes is crucial to avoid building a business-oriented flow that would likely make the online experience confusing and cause frustration.
The outputs of steps 2 and 3 also lead to the identification of best-in-class product titles and thesaurus fix recommendations (to ensure relevant research results are still shown if customers make common typos using the search tab) which, in our example, contributed to improve the Search results (based on how the algorithm behind the retailer’s website worked).
Category expertise, common sense, and wider market knowledge also play a role in refining the output of the previously described steps and building the optimal hierarchy, while the data is at the core of it.
Step 4: Measure and refine
Best practice is to conduct an evaluation of the changes made a few months post-implementation, to check how customers have responded and if there is any adjustment to make. Key metrics to track can include sales uplift, shelf conversion, search term conversion, friction etc.
Going back to the BWS example, when a 12-week post-implementation assessment has been conducted, we found great results in terms of impact:
- +3% conversion of top search terms across the whole category
- Improved shelf conversion across BWS (e.g. Gin +65%)
- -30% friction, showing a smoother journey and navigation for customers leading to purchase
As consumer needs and market trends constantly change, the target inevitably keeps moving. This is why it is important to review the performance and ‘challenge the status quo’ periodically to identify further areas for improvement, while being conscious that the results might be influenced by other factors (e.g. Covid restrictions, product availability, seasonality etc.) that might not be easy to strip out from the review.
Conducting this type of work also presents the perfect opportunity to carry out a more in-depth exploration of customer needs and expectations in terms of online shopping, by asking them directly via customer research , to also identify emerging trends and how the customer experience could be further improved. This type of research can shed further light on a range of areas such as naming conventions, purchase journey consideration, website performance and usability of different devices, customer pain points, the need or desire for enhanced content. The applications are endless but ultimately the aim is to enhance the insight from the data science by bringing the needs and voice of the customer to you.
Conclusion
With online shopping becoming a habit for more and more people, it is crucial for retailers to act to ensure a smooth and pleasant digital journey; how products are displayed and grouped online plays a key part in this, as it does in-store. Thanks to advanced data science and tools, it is possible to identify the required changes and provide a better shopping experience while increasing sales, with the confidence that only customer data can give.
RELATED PRODUCTS
Insights
The latest insights from our experts around the world