Blog
Using price elasticity to measure price sensitivity
By David Hoyle, dunnhumby Price & Promotion Science
At some point in every general election in the UK, a news reporter will interview a politician who is keen to show that they are in touch with the electorate. The interviewer will ask the politician the current price of a pint of milk[1], or the price of a loaf of bread. Almost every time the politician doesn’t know the answer and ends up horribly embarrassed.
Why does this matter? Well, because most ordinary voters would know the price. They likely have a set weekly budget for buying groceries. The ordinary voter notices when the price of milk goes up. The ordinary voter is price sensitive.
So why is it important for retailers and brands to understand how price-sensitive customers are about milk? Well, customers’ price sensitivity will strongly influence how retailers set their prices. So, how do you measure price-sensitivity? Through price-elasticity.
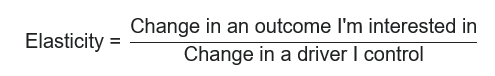
Wait a minute you say! Elasticity, isn’t that the stretchy stuff that holds clothes up? Well, yes. But when Robert Hooke carried out his original investigation into elasticity in 1676, he summarized his findings in the pithy Latin phrase, “ut tensio, sic vis”. Translated, this means, “as the extension, so the force”. In other words, the increase in the length of an object is proportional to the increase in the force I’m applying to that object. So, an elasticity as a general concept is just defined as,
How do price-elasticities quantify price-sensitivity? Consider what would happen if we increased the price of a product in a supermarket. We would expect that as we increase the price the number of units sold would go down. This pattern is illustrated in Figure 1 below.
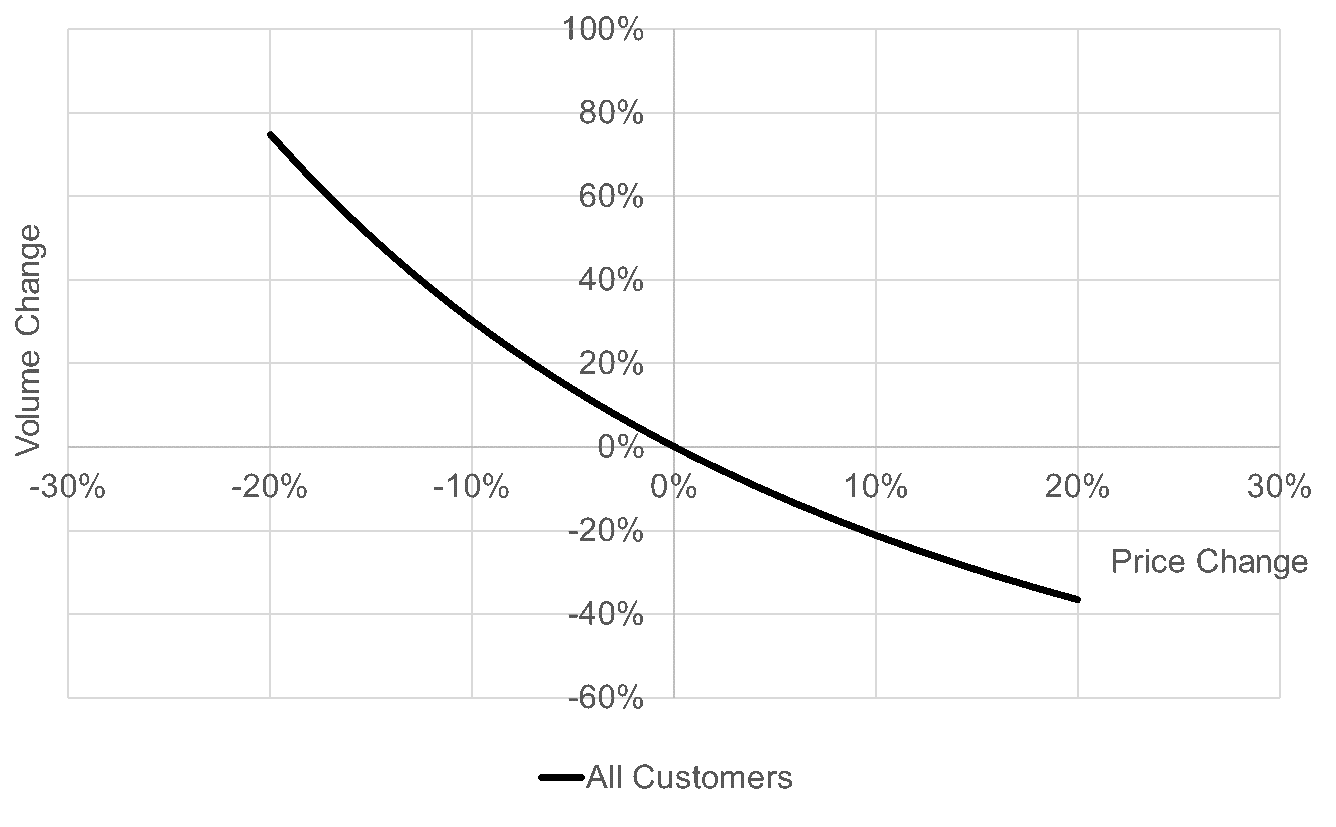
Figure 1: Schematic plot of the typical price-volume curve we would expect for a supermarket product.
How quickly the sales (number of units sold) go down as we increase the price tells us how price-sensitive our customers are for this particular product. The rate of decrease in units is just the gradient (slope) of the curve at the origin, and so this gradient gives us a means of quantifying the price-sensitivity. The gradient is measured as,
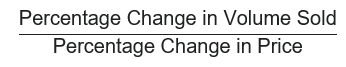
and so we can see that the gradient is of the form of an elasticity. We call this the price-elasticity of demand.
In grocery retail it is natural that we are interested in the sales response to a percentage change in price. This is because shoppers are naturally more attuned to a percentage change in a product’s price than an absolute change in its price. For example, consider a product whose price increased by £1. If the product originally cost £1, then a £1 increase represents an increase of 100% – the product is now very expensive compared to what it had previously been priced at. However, if the product had previously cost £100, a £1 increase represents a 1% increase, and its new price point is still in the same ballpark as its old price point – the product will still be competitive within its market.
The numerical value of the direct elasticity tells us what percentage change in units sold we would expect to see for a 1% increase in price. In Figure 1 the slope of the curve at the origin is negative. It is in fact -2.5. This tells us that a 1% increase in the current price would lead to an approximately 2.5% decrease in units sold.
So, now you know a little more about the science of price elasticity, and how it’s used to measure price sensitivity levels of individual grocery products. Keep your eyes out for my follow-up article in which I’ll look at the drivers of price sensitivity and how retailers can influence these.
[1] The UK Office for National Statistics (ONS) has a convenient website with the price of a pint of milk, https://www.ons.gov.uk/economy/inflationandpriceindices/timeseries/cznt/mm23
RELATED PRODUCTS
Insights
The latest insights from our experts around the world